SYSTAT 11: More Statistics, More Graphs, Less Effort
Integrated desktop statistics and graphics package features many improvements
John A. Wass, Ph.D.
SYSTAT is an old friend that keeps improving with age. It is statistical software that does a variety of sophisticated testing beyond what the non-statistician would usually need for simple analysis. As such, its use covers a wide area of disciplines and skill levels. The present version not only adds several important tests and capabilities, but is also more user-friendly in that the menu-driven elements have proliferated and become more versatile. For example, a redesigned user interface has combined the output, data and graphics windows into a single, tabbed window. User's can now customize menus to frequently used functions, and enhanced, right-click mouse functionality. To ease import from other programs, SYSTAT can accept StatView, Stata, Statistica, JMP, MINITAB, and S+ data formats. The functions of the graphics editor have been enhanced to allow more extensive customization and export options. The showcase upgrade (to an admittedly biased editor) is the addition of Monte Carlo methods and an enhanced spreadsheet to its repertoire. This edition was developed for Windows (NT4, 98, 2000, ME, and XP) and the review was done on a Windows 2000 Professional platform.
The program was originally loosely modeled after the SAS system and, as such, maintains a tradition of supporting serious research as opposed to casual use. The developers highlight its robust nature, efficient analyses, and presentation quality graphics. A partial listing of new features is given in Table 1.
Installation
Installation of the standard features took 105 seconds on a Pentium III with a 1.3 GHz clock, of which 40 seconds were spent removing older backup files. A new icon was placed upon the desktop and the program booted from this with no problems.
Documentation
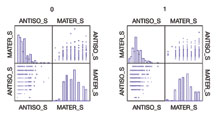
Figure 1: Scatterplot matrices
Long-time readers of my software reviews will recognize that I'm a paper manual aficionado. After staring at a screen for long periods during the course of an analysis, it is always relaxing to scan the non-glare surface of a well-written and indexed manual for further information. (I may be in a minority these days.) Seven manuals are supplied, and most time was spent with the first half of the 'Getting Started Manual', as well as the 'Data' manual and the three statistics manuals. There are also 'Graphics' and 'Language Reference' manuals.
Although well-written and fairly complete, all manuals suffer from lack of a detailed index. These sections should be twice as long as they are and, perhaps, be based on surveys of new users. This would be valuable as the novice could advise the developers as to the most perplexing problems for beginners. That said, let's take a brief look at the more important aspects.
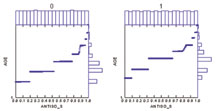
Figure 2: Scatterplots with side histograms
'Getting Started' does an exceptionally good job as a teaching tool as it is not merely a dry recitation of pushbutton sequences but, rather, makes use of real-world (though simplistic) examples. The first example is typed in, but SYSTAT contains many prepared data sets that may be used. The example of food brands with calorie and fat content data is almost becoming standard these days, with good reason. The short data set is used as an example of simple data snooping with graphics, using the commandspace, reading text files, sorting and listing cases, summary statistics, relationships among variables, examining subpopulations and simple comparative statistics. The subsequent sections cover a quick tour of statistics and the command language, as well as customizing the work environment and a brief listing of simple programs useful to a variety of disciplines. The 'Data' manual extends the basics by detailing how data may be entered, edited, manipulated, and further transformed.
Table 1: Selected New Features in SYSTAT 11
Statistics is given lengthy treatment in the three thick manuals that that all follow the following format: Introduction, Statistical Background, Examples, and References. In addition, each volume starts with a listing, by page number, of examples, as well as a complete contents section and index for all three volumes. This is a nice feature that really helps to do a quick lookup. A detailed discussion of the volumes is unnecessary but suffice it to say that the statistical introductions are not only clear and fairly complete at the beginner's level, but contain historical as well as statistical items. The examples contain many instances of one of the more important features of these packages, i.e., the use of diagnostics. The depth of most explanations will not transform the novice into a statistician, but they will allow a greater understanding of the analysis and interpretation of the output.
Workspace
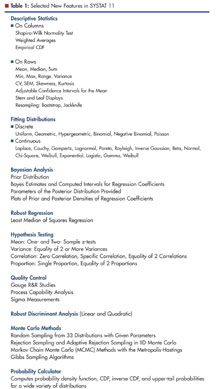
Table 2: An Outline of Statistical Procedures in SYSTAT 11
Here is another pleasant surprise. Although the "pseudospreadsheets" of the past were adequate to the smaller databases usually utilized, in the modern age of genomics, proteomics and data mining of large sets, an ability to import and analyze very large data sets is imperative. I had initially noticed that the worksheet was only 20 columns by 30 rows. However, I quickly discovered that this sheet will expand to fit the dataset, and a 24 column by 22,300-row genomics data set was easily opened (with the proper headers) within 12 seconds. Although not a fully functional EXCEL spreadsheet, it features a variety of options to allow data manipulation. The sort command takes a little getting used to for those accustomed to the standard EXCEL sort (it will expand the selection without asking and place some data based on preset cell lengths), as did the transpose and reshape buttons. Functions such as select cases, weight, variable ID, and frequency are very useful, however, and greatly speed mass data manipulations. As with any new program, there will be a learning period as the novice acclimatizes to a new way of doing things.
The bootup display includes a viewspace (explorer-like function that allows for fast work overviews), a workspace (spreadsheet), command space (log and editor for the programming language), and features an output organizer, dynamic explorer and standard tool and menu bars. Mercifully, there is a very complete list of file formats that are accepted by SYSTAT, which includes Excel, SPSS, SAS, BMDP, MINITAB, S-Plus, Statistica, Stata, JMP, and ASCII. |
