Create Graphs Easily with SigmaPlot!
- SigmaPlot´s Graph Style Gallery:
Save any graph with all graph properties
and add a bitmap image to the gallery to
create complex graphs.
- Graph Toolbar: select toolbar icon of the
graph type and style you want to create
or to add additional curves to an existing
graph.
- Graph Wizard: easy to use, step-by-step
wizard for helping you select a graph type
for your data.
- Default Graph Settings: set preferences
for graph options to create favorite graphs
quickly.
- Templates: create custom graph page templates
and store them for easy accessibility and
future use.
- "Intersections" are now supported
for area fills.
- Improved Graph Wizard: retains your last
settings. Click 'Finish Early' and
Gallery Graphs are all listed.
|
|
2D Graphs
- Area Plots - 4 Types
- Scatter - 14 types
- Line - 4 types
- Scatter and Line - 10 types
- Step - 8 types
- Vertical Bar - 2 types
- Horizontal Bar - 2 types
- Vertical, Grouped Bar - 2 types
- Horizontal, Grouped Bar - 2 types
- Vertical, Stacked Bar
- Horizontal, Stacked Bar
- Box - 2 types
|
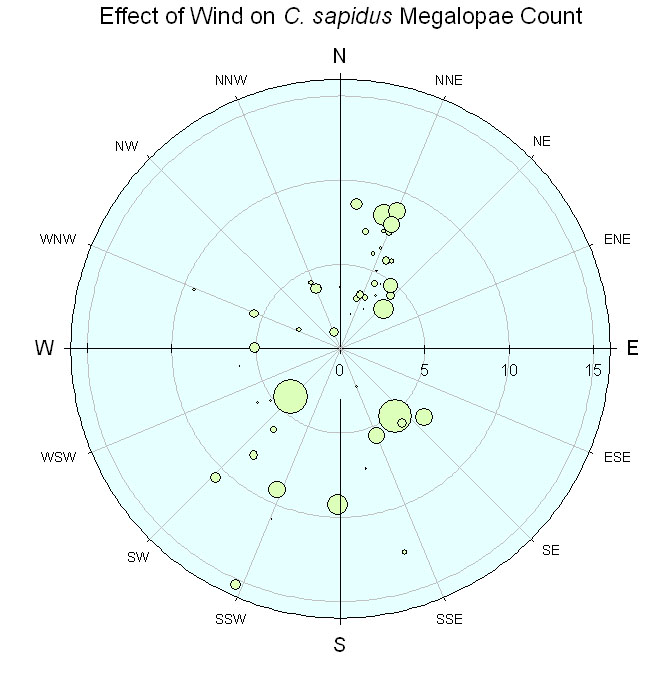
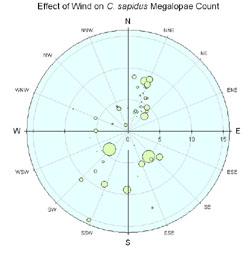
- Polar - 3 types
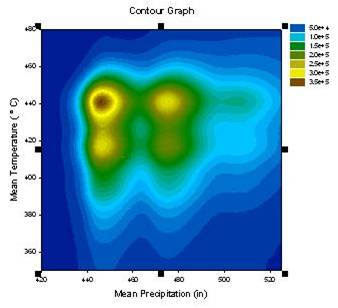
- Contour, line and filled - 2 types
- Histograms - 6 types
- Ternary - 3 types Time-Series
- Bubble
- Pie
- Control Charts
- Needle
- High-low-close, Range, Quartile
- Quadrant
- Population
|
|

|
|
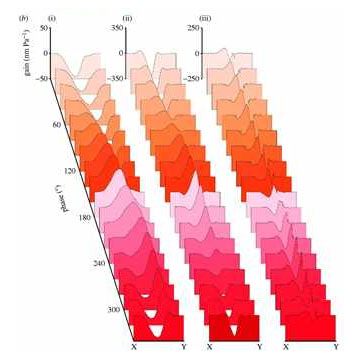
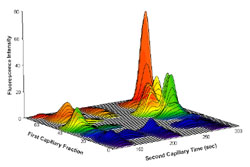
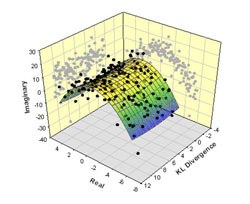
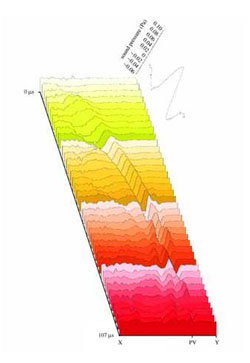
3D Graphs
- Multiple, intersecting plots with hidden
line removal, smooth or discrete shading,
transparent or opaque fills and light source
shading
- 3D rotation
- Perspective preview
- Scatter
- Bar
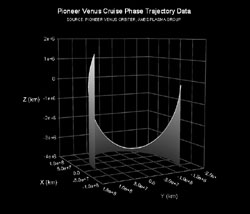
- 3D line - trajectory
- Mesh
- Contour
- Waterfall
|
|
|
Technical Axes
- Linear
- Log10
- Natural log
- Probit
- Logit
- Probability
- Reverse
- Ternary percentage
- Ternary unary
- Polar
- Category (text data automatically binned
into groups)
- Time and date
- User-defined custom axis to create Arrhenius,
Weibel and many others
|
|
|
Axis Features
- Control of display, thickness, color, range and axis breaks
- Offset axes
- Automatic titles
- Multiple axes: Add Axis Wizard for creating multiple axes easily
- Ticks: customize major & minor intervals,
in & out orientation, top & bottom
location, length, thickness, color and tick
mark selection from column to create custom
axes
- Labels: customize prefix, suffix, numeric,
and time & date
- Axis breaks: customize symbol, thickness,
color, length, gap width and post break
interval
|

|
|
Error bars
- Mean, Median, First and Last values for
symbols
- Standard deviation, Standard error
- 10th, 25th, 75th and 90th Percentiles
- Min and Max
- 95% or 99% confidence
- Calculate error bars from replicate values
across rows
- User-defined upper and lower error bar
values
- One way, two way and asymmetric error bars
- Percentile method: choose between nearest
integer (graphical) or value dependent (numerical)
algorithms
|
|
|
Grids and Fills
- Control of color, line type, thickness and display
of major & minor grids in X, Y& Z direction
- Control of pattern and edge color, pattern
style, pattern density and edge thickness
Symbols
- Over 80 symbol types
- 30 new symbol types that include half-filled and BMW styles
- Edit font when using text as symbol
- Access new symbols directly from graph properties dialog, toolbar, legend page and the symbol dialog box
- More line types such as dash and gap patterns
- More fill patterns for bar charts and area
plots
|
|
|
Reference Lines
- Control mean, standard deviation, standard error, userdefined constants, 95% and 99% confidence intervals
- Up to 5 horizontal or vertical lines
- Control of color, line type and thickness Drop lines
- Display in any or all X, Y and Z directions
|
|
|
Function Plotter
- Plot 2D and 3D functions
- Over 100 2D and 3D built-in, graphically-illustrated equations
- User-defined parameters; scale and range
- Customize the SigmaPlot library of functions or create your own
- Plot functions on new or existing graphs
- Plot multiple different parameter values simultaneously
- Select line properties for each function
- Equation Solver: solve equations or functions
containing a single independent variable
and any number of parameters
|
|
|
Graphs Created Through Transforms
- Gaussian cumulative distribution
- Area - shading under and between curves
- Z plane design
- Vector
- Kaplan-Meier survival
- Frequency
- Complex Control charts
- User-defined axes
|
|
|
Multiline Text Editor
- Control font, size, style, color, Greek,
multiple levels of superscript & subscript,
360 degree rotation, left, right & center
justification and line spacing
Legends
- Automatic or manually created
- Legends for regressions, confidence and prediction intervals
- Turn on and off lines and symbols
- Place line and symbol before or after
text
Export Graphs Options
- Export an individual graph, a group of graphs and objects or an entire page
- Different levels of resolution and color depths: PDF, EPS, TIFF, JPEG, WMF, BMP
- True color EPS vector and CMYK EPS export
- Compressed CMYK TIFF
- Publication Help: guides user through
the complexities selecting the correct
DPI, image size, file export format
Publish as Web Page
- Export graphs as high-resolution Web objects
- WebViewer: free browser plug-in to view data used create graph or print, pan and zoom in on graph without losing resolution
- The WebViewer supports IE 4.01 or higher. A screenresolution
JPEG file is automatically displayed for browser
applications and operating systems.
|
|
|