Curve fitting is finding a curve which matches a series of data points and possibly other constraints. It is most often used by scientists and engineers to visualize and plot the curve that best describes the shape and behavior of their data.
 Regression procedures find an association between independent and dependent variables that, when graphed, produces a straight line, plane or curve. Regression procedures find an association between independent and dependent variables that, when graphed, produces a straight line, plane or curve.
The independent variables are the known, or predictor, variables. These are most often your X-axis values. The dependent variables are also called as response variables and are most often your Y-axis values.
Regression finds the equation that most closely describes, or fits, the actual data, using the values of one or more independent variables to predict the value of a dependent variable. The resulting equation can then be plotted over the original data to produce a curve that fits the data.
Dynamic Curve Fitting
Nonlinear curve fitting is an iterative process that may converge to find a best possible solution. It begins with a guess at the parameters, checks to see how well the equation fits, the continues to make better guesses until the differences between the residual sum of squares no longer decreases significantly. For complicated curve fitting problems, use SigmaPlot’s Dynamic Fit Wizard to find the best solution.
The Dynamic Fit Wizard automates the search for initial parameter values that lead to convergence to the best possible solution.
Like the Regression Wizard, the Dynamic Fit Wizard is a step-by-step guide through the curve fitting procedures, but with an additional panel in which you set the search options (in the figure below).
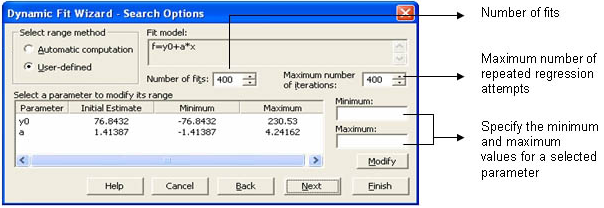
Please note that the Dynamic Fit Wizard is especially useful for more difficult curve fitting problems with three or more parameters and possibly a large amount of variability in the data points. For linear regressions or less difficult problems, such as simple exponential two parameter fits, the Dynamic Fit Wizard is overkill and you should be using the Regression Wizard.
Remove measurement noise
Fill in missing data points, such as when one or more measurements are missing or improperly recorded
Interpolate, which is estimating data between data points, such as if the time between measurements is not small enough
Extrapolate, which is estimating data beyond data points, such as looking for data values before or after a measurement
Differentiate digital data, such as finding the derivative of the data points by modeling the discrete data with a polynomial and differentiating the resulting polynomial equation
Integrate digital data, such as finding the area under a curve when you have only the discrete points of the curve
Obtain the trajectory of an object based on discrete measurements of its velocity, which is the first derivative, or acceleration, which is the second derivative
Visit the links below for more technical information and examples of how curve fitting is easy using SigmaPlot.
Case Study: Curve Fitting using SigmaPlot
Global Curve Fit of Enzyme Kinetics
Global Analysis of Concentration-Response Curves
Using Global Curve Fitting to Determine Dose Response Parallelism
Global Curve Fitting for Ka and Kd from Sedimentation |