OVERVIEW 2

Graphing Software that makes Data Visualiation Easy

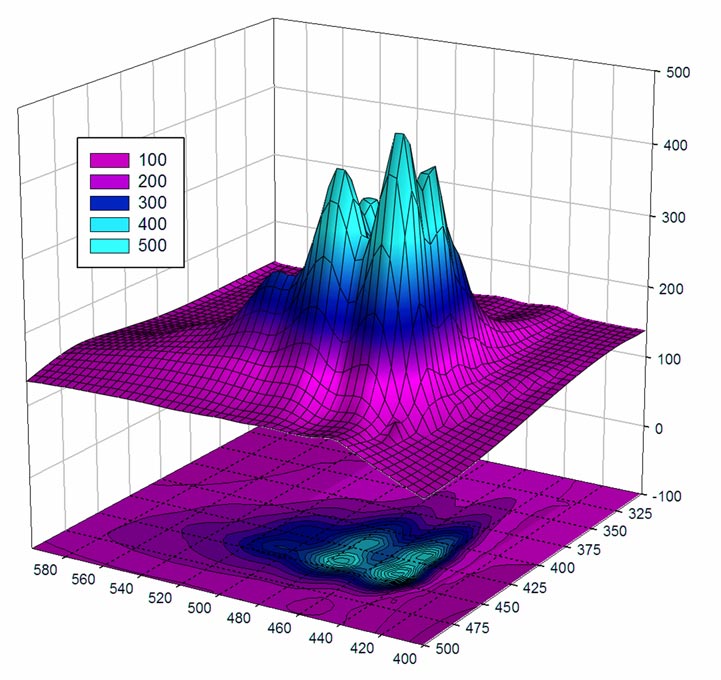
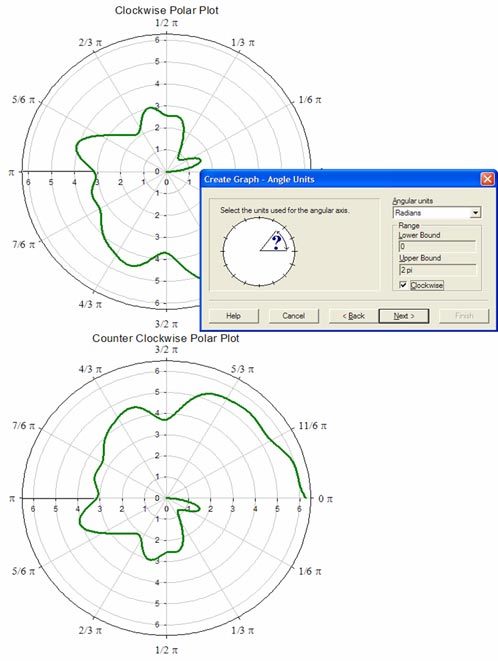
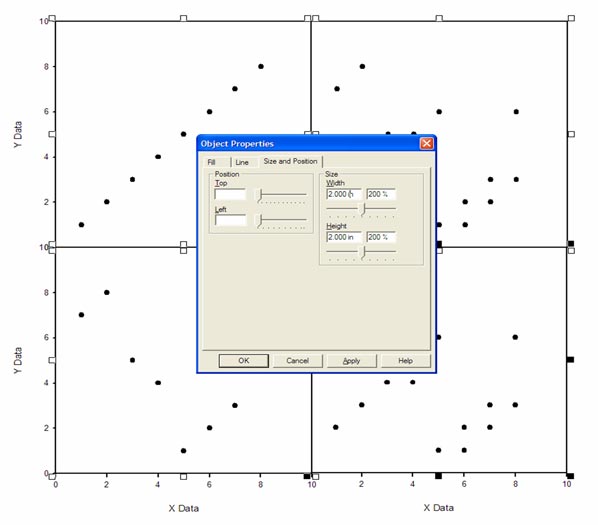
Graph creation starts with SigmaPlot's award-winning interface. Take advantage of industry-standard menu design, menu toolbars, right mouse button support and graph preferences. Select the graph type you want to create from the Graph Toolbar's easy-to-read icons. The interactive Graph Wizard leads you through every step of graph creation. You get compelling, publication-quality charts and graphs in no time. SigmaPlot offers more options for charting, modeling and graphing your technical data than any other graphics software package.

Compare and contrast trends in your data by creating multiple axes per graph, multiple graphs per page and multiple pages per worksheet. Accurately arrange multiple graphs on a page using built-in templates or your own page layouts with SigmaPlot's WYSIWYG page layout and zoom features.

SigmaPlot Web Viewer support Microsoft Internet Explorer 4 .01 or higher. A screen-resolution JPEG is automatically displayed for the other browser applications and operating systems.SigmaPlot Web Viewer support Microsoft Internet Explorer 4 .01 or higher. A screen-resolution JPEG is automatically displayed for the other browser applications and operating systems.


MY Office : 72-3C, JALAN PUTERI 2/4, BANDAR PUTERI, 47100 PUCHONG, SELANGOR, Malaysia. Tel:+603-8063 9300 fax:+603-8063 9400
SG Office : 259, Onan Road, Singapore 424651. Tel: +65-6468 3325 Fax: +65-6764 5646