ANALYSIS OF LIGAND BINDING DATA
Introduction
This SigmaPlot Version 7.0 macro allows you to analyze ligand binding and dose response data easily and quickly. The most common equations for these analyses are included (displayed below) and you can add your own equations if you wish. Analysis of multiple compounds with replicate measurements is simple. The macro creates a graph of the results consisting of a scatterplot of replicate means and standard error bars plus fit lines for each pharmaceutical compound. A report with the equation fit results including EC50 values and the associated error analysis is also created. Click on the link ligandbinding.exe to access the setup program to install this macro.
Typical Competition Analysis Results
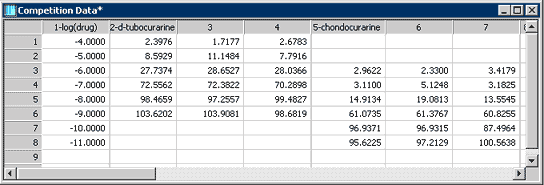
Two of eight competition binding data sets are shown in the SigmaPlot worksheet in Figure 1. There are three replicate measurements for each compound.

Figure 1. Data format for the Ligand macro. Drug concentrations are entered in column 1. Replicate binding data is entered in subsequent columns. Column titles are used in the graph legend and report.
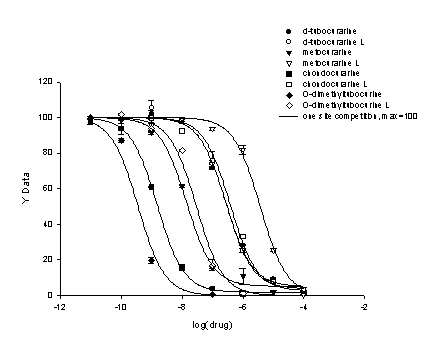
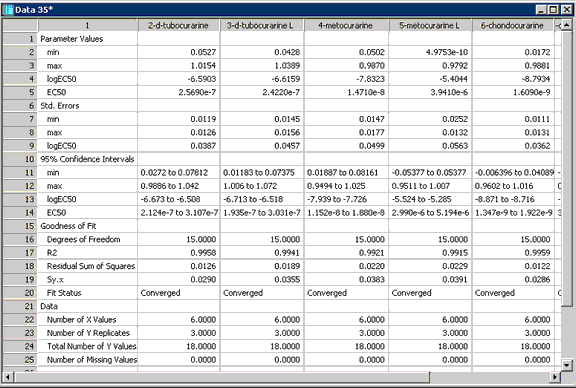
Using the single site competitive binding model the eight data sets were analyzed producing the graph in Figure 2 and report in Figure 3. In this case maximum binding was fixed to equal 100.

Figure 2. Results of one-site binding fit to eight data sets with a constant maximum equal to 100. The specific compounds analyzed are documented in the legend.

Figure 3. The report produced by the Ligand macro. Parameter values, their associated statistics and goodness of fit results are displayed for five of the eight data sets.
Using Ligand
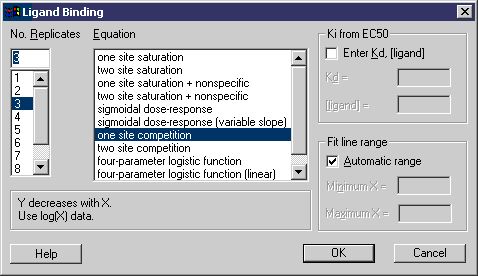
Enter data as shown in Figure 1 and then run the Ligand macro. The Ligand dialog is displayed.

The equations provided are shown in the Equation window (and you may enter your own equations). Select the number of replicates and the particular equation desired and click Ok. This produces the results shown in Figures 2 and 3.
You may compute Ki to determine the affinity of the receptor for the competing drug by selecting the checkbox
 |
 |
and entering the Kd and concentration of the bound radioligand. The Ki will then be computed from the Cheng-Prusoff equation above and displayed in the report (not shown in Figure 3).
The fit lines are drawn over the range of the x-data by default. For some graphs you may wish the fit lines to start at zero, for example, or extend beyond the data range in some way. You may do this by unchecking the Automatic range checkbox and entering the appropriate range.

Detailed help is included with the macro.
Summary
You may download ligandbinding.exe to run with SigmaPlot Version 7.0 to analyze your ligand binding and dose response data. The results are displayed both graphically and in report form.
|

